

RiverState app for iPhone and iPad
Developer: Verbatim Interactive as
First release : 01 May 2012
App size: 14.3 Mb
RiverState - or River Water Flow Status - tells you the water flow status of 236 Norwegian rivers and waterways with up to the half hour updated water flow status from the Norwegian Water Resources and Energy Directorates network of measuring gauges.
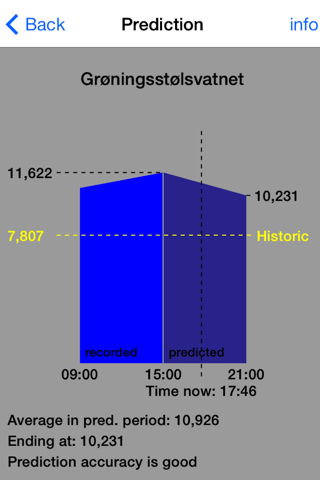
Based on historical patterns of water flow and rain fall, the app can indicate the likely flow development the next six hours.
Know when the river is rising and the Salmon will be running, conditions are perfect for rafting, or simply check whether the river is approaching or receding from flood levels.
Use the positioning function to see where you are in the map relative to the closest flow measurement points in the river.
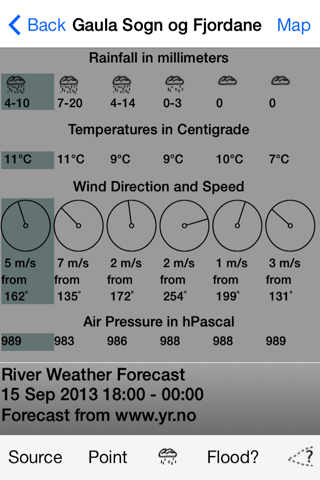
A detailed weather forecast for a selected river, can help you decide what will happen in the next few days.
A flooding indicator tells you exactly where the current flow is compared to historical flooding levels.
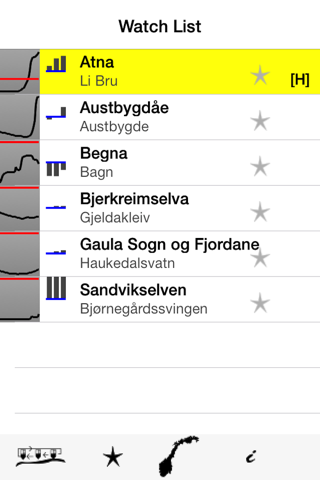
- Navigate the list of all rivers or use the map to find the rivers or waterways you are interested in.
- Build a watch list of key rivers and see their water flow, flow change and flooding status in one view. Know instantly whether conditions are good for rafting or fishing, or whether you need worry about flooding.
- Water flow status is updated up to every half hour.
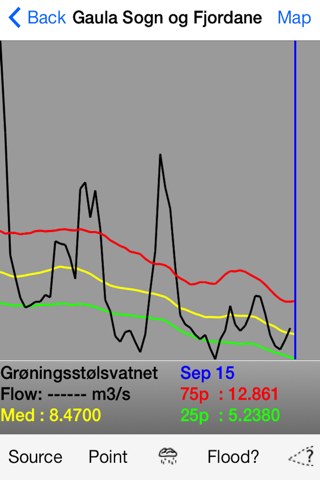
- All rivers have daily water flow and water level statistics. Slide the blue origin line across the flow-plot to see historical values.
- Most measurement points have air temperature readings
- Many measurement points have water temperature readings.
- Most measuring points have recorded historical flow levels for the specific date you are looking at so you can see whether the current flow is on average , below the 25% lowest levels measured or above the 75% highest levels measured on the day. This lets you know whether the river is high or low relative to the normal condition for the day of the year.
- Most measuring points have recorded historical flooding levels. A screen lets you see the current water flow relative to the average highest flow for a single year, the highest flow over a 5, 10 and 50 year period.
The App uses environmental data published by the Norwegian Water Resources and Energy Directorate and weather data from the Norwegian Meterological Service, both used with permission.